Fading channel modeling is a fairly common step while performing any communication system analysis. This article deals with how to model a fading channel with the assumption that channel taps are sample spaced. The first section tells what are the sample spaced taps of the channel and next the discussion is about how can we model such channel in MATLAB along with an example script.
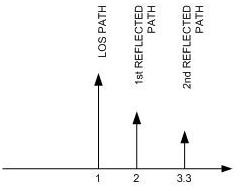
What does it mean by "sampled spaced taps"? Suppose you have the simplest communication system perspective consisting of a transmitter, channel and receiver where the transmitted waveform passes through the channel and is received by the receiver after getting reflected from different obstacles. While modeling we need to discretize the channel so that it can be simulated in MATLAB or any simulation environment i.e. take channel response at particular time instants and not all the time. So a discrete channel is defined by a set of impulses at particular instant of time instead of a continuous response. These impulses at particular instants are called channel taps and every tap corresponds to a seperate reflected wave that comes after some delay. Quite intuitively, there is no binding on the lengths of paths that these reflected waves travel so there is no binding on how delayed these reflected signals will be received. For example, the second wave can come after a span of 1 microseconds of the first wave and the third wave can come after 2.3 microseconds of the second wave. By sample spaced channel taps, we mean that the difference in delays between different waves is either some sampling interval Ts or a multiple of it.

Now, to model the first channel is quite difficult as compared to the second one because the second channel can easily be implemented using a 3-tap FIR filter as the sampling frequency is fixed.
So, this is quite apparent that if we want to model such channel using an FIR filter i.e. assuming sample spaced taps, we will have to input the waveform samples (that comes out of the transmitter) with the same sampling interval as that of the time interval between the FIR channel taps. With this assumption, we cannot simulate a channel where taps are not uniformly spaced. For this, we will have to interpolate the input wave and/or the channel response. This will be discussed in the next section of this tutorial. In this article, we consider only the case where channel taps are sample spaced i.e. the time interval (or 1/Sampling Frquency) of the signal is the same as that of channel.
All right! We are now ready to simulate the whole process. Lets take an example of modeling the following channel to clarify the whole picture.
Channel Specifications
- No. of Taps = 4
- No. of Independent Channel Responses = 2000
- Tap Weights and Delays
- First Tap = 0 dB with delay of 0 microseconds
- Second Tap = -5 dB with delay of 5 microseconds
- Third Tap = -10 dB with delay of 10 microseconds
- Fourth Tap = -15 dB with delay of 15 microseconds
- The sampling frequency of the input signal = 1/5 microseconds = 200 kHz
This channel is sample spaced because,
sampling interval of input signal = 5 microseconds = Mx(delay difference between two consecutive taps) where M = 1.
The channel is depicted in the following figure.

First we will make 4 independantly rayleigh faded channel taps. This can be easily done by using the fact that the envelope of two gaussian processes with the same variance and mean is rayleigh distributed. One can make a rayleigh faded tap quite easily using following equation and code in MATLAB.
---------------------------------------------------------------
%% MATLAB Code
no_of_taps = 4;
averaging_interval = 2000;
tap_weights_db = [0 -5 -10 -15];
tap_delays = [0 5e-6 10e-6 15e-6];
% Conversion of dBs scale into linear one
tap_weights_ln = 10.^(tap_weights_db/10);
% Calculation of normalization factor to make the average power of output
% signal to 1
norm_fact = sqrt(sum(tap_weights_ln));
% Generating a Rayleigh Random Variable with average power 1
taps = 1/sqrt(2)*(randn(averaging_interval, no_of_taps) + j*randn(averaging_interval,no_of_taps));
% Making average power of different taps to specified value
taps_weights = taps.*repmat(sqrt(tap_weights_ln), averaging_interval,1);
% Applying to normalization factor
taps_norm = 1/norm_fact*taps_weights;
---------------------------------------------------------------
Normalization Factors
In the above code, there are two normalization factors involved.
| 1. | |
| 2. | norm_fact |
The need for these normalization factors arise due to the following reason. When we talk about different taps, actually different replicas of the signal is being added with different delays. The result is that the output signal from this multipath channel has power more than what was input to the channel. For example, if we have input a signal of power 1, the output of channel shouldn't at least exceed a power of 1. That's why the tap values are scaled so as to make the total output power equal to 1 for an input signal of power 1 while adding all the replicas. Further, every tap is also a summation of two signals in quadrature each with variance (average normalized power in the AC component) equal to 1. In summary, we need normalization at two stages.
- To make average normalized power of rayleigh faded process equal to 1.
- To make average normalized power of all the rayleigh faded taps equal to 1.
In fact, both of these normalization process can be combined as for 2nd normalization we are assuming that each tap has power 1.
The very first question now arises what is the power of two normally distributed processes added in quadrature? This can be perceived as follows. The randn command creates a gaussian distributed random variable with zero mean and variance 1. Since, variance represents the average normalized power in the AC (varying) component of the signal, we can say that randn will create a gaussian distributed random variable with 0 DC value and 1 average normalized power in AC component. So, we know that the AC power of the two normally distributed R.Vs added in quadrature is 2 with an amplitude of sqrt(2). To make this signal with amplitude sqrt(2) into a signal of amplitude 1 (that will give in return a power of 1^2 = 1), we need to divide the signal with sqrt(2). That's all about the first normalization factor. It just makes the average normalized power in the AC-component of two normally distributed R.V.s added in quadrature to a value of 1.
The same analogy can be applied to the understanding of 2nd scaling factor. We needed first scaling factor because we were adding two signals each of power 1. Now, each tap represents a signal of power 1 and they are being added with different weights (and thus different average powers) to each other to produce the effect of multipath. In our case, the same signal is added 4 times (because of the 4 taps) and the average output power is equal to the sum of average powers of the four taps. As described in the channel specification, the power of different taps is as follows.
- First Tap = 0 dB or 1 with delay of 0 microseconds
- Second Tap = -5 dB or 0.316 with delay of 5 microseconds
- Third Tap = -10 dB or 0.1 with delay of 10 microseconds
- Fourth Tap = -15 dB or 0.0316 with delay of 15 microseconds
Thus, the total output power of this channel is 1+0.316+.1+0.0316 = 1.447. If we input a signal of average power 1 to this channel, the average power of the output of the channel would be 1.447. To make the average power of the output signal to 1, we need to divide the taps by sqrt(1.447) = sqrt(sum of linear values of the taps) as done in the code. In summary, both of these normalization factors were incorporated to make the average output power of the channel equal to 1 for a signal of input power 1.
Generating The Taps
Finally, all the taps are generated using these normalizations and two independent gaussian random variables. Following is the code that proves that the average normalized power of different taps is as specified in the channel.
---------------------------------------------------------------
%% MATLAB Code
disp('The path gains are as follows (in dB)');
20*log10(mean(abs(taps_norm),1))
disp('The total path gain of the channel is');
sum(mean(abs(taps_norm).^2,1))
---------------------------------------------------------------
The complete MATLAB script can be found here.
The physical meanings of different statistical parameters such as mean, variance etc. are given in chapter-1 of Digital Communications: Fundamentals and Applications (2nd Edition) (Prentice Hall Communications Engineering and Emerging Technologies Series).


hi,
ReplyDeleteLet me introduce myself as ramys.I am a member of matlab@yahoogroups.com.
I happen to read your article on fading channel model.
Since i am a novice to probability. i dont know where do you get the concept of modelling rayleigh faded signals by adding two quadrature phase iid guassian random variables.
Its a nice concept.can U tell me or suggest me the theory or article supporting this concept.what specific technicall paper should i need to follow inorder to hone up my skills theoretically stronger.
from your matlab code i cant understand this particular line. of what u r trying to do
% Making average power of different taps to specified value
taps_weights = taps.*repmat(sqrt(tap_weights_ln), averaging_interval,1);
can u pl explain me with patience.
my email Id:
ramyaravi80@yahoo.co.in
Thanks a lot in advance....
This is the definition of the Rayleigh Distribution.
ReplyDeleteZ = sqrt(X.^2+Y.^2).
where X and Y are gaussian random variable.
as described in the article. You google about rayleigh random variable and you get many websites explaining this to you. Alternatively, you can write your own MATLAB code for its verification. Generate two gaussian random variables using randn command. Add them in quadrature and then take the absolute value of the resulting complex numbers. Plot it... you will see Rayleigh Mountain.
Regarding your second question, as the comment says this line makes the average power of the different taps to the value dictated by the power delay profile. Without this line, all the three or four taps have equal average power. But, when you multiply it with a specific weight, their values are scaled in a way that they give you average power equal to
tap_weights_db = [0 -5 -10 -15];
Without that line the taps average power would have been same for all the taps.
Thank U for your response Sir. With your tips i got it right generating rayleigh pdf by using the code
ReplyDeleteN=10000; z = [0:0.01:5]; [nzSim zBinSim] = hist(abs(randn(1,N)+j randn(1,N)), z);
plot(zBinSim,nzSim/(N*0.01),'m');
I have a few questions reg Channel Specifications.
1..Since, channel taps are sample spaced:
waveform samples (that comes out of the transmitter)
with the same sampling interval will be same as that of the time interval
between the FIR channel taps.
From Power delay profile
The time interval between the FIR channel taps= 5 μs= sampling interval of input signal
From your theory, I read:
The sampling frequency of the input signal = 1/5 microseconds = 200 kHz
I understood this, but this line
sampling interval of input signal = 0.2 microseconds = Mx(delay difference between two consecutive taps) where M = 1.
I cant understand how 0.2 microseconds will be the sampling interval of i/p signal.
What does then ‘M’ and ‘x’ refers to. Whether M refers to no.of signals that has been txansmitted to the multipath fading(Rayleigh) channel.
2. when you multiply it with a specific weight, their values are scaled in a way that they give you average power equal to tap_weights_db = [0 -5 -10 -15];
So when I do to get back tap weights in db
PDFpowerdelayprofileindb=10*log10(mean(abs(taps_norm).^2));
Answer is [-2.6094 -8.6696 -10.7163 -17.4142 ] instead of tap_weights_db = [0 -5 -10 -15];
Why is there a difference in dB. Is it because of normalistion done at two places?
Can U pl tell me in this regard.
Your questions answered in the order they are asked!
ReplyDelete1. It is a typo. It should be 5 microseconds. Thanks for correction. M refers to being sample spaced. That means your 2nd, 3rd or 4th taps are not necessarily sampling interval apart. The difference between two channel taps can be an integral multiple of sampling interval and you can still use the same methodology for simulating this channel. For example, with the same methodology you can simulate the following channel too.
Tap Weights and Delays
1. First Tap = 0 dB with delay of 0 microseconds
2. Second Tap = -5 dB with delay of 10 microseconds
3. Third Tap = -10 dB with delay of 15 microseconds
4. Fourth Tap = -15 dB with delay of 25 microseconds
Note that the difference between channel taps is not sampling interval. Instead it is an integral multiple of 5 microseconds. Still, the same methodology as explained above can be used for this particular channel.
2. Yes you are right! It is because of the normalization. But, still your answer is not correct. The difference between different taps should be the same i.e. the 2nd tap should be 5 dB down first tap and so on. I run the same script and got the following answer.
-2.5196 -7.6147 -12.7654 -17.8112
Note the difference between the taps
- 7.6 + 2.5 = -5.1 dB
- 12.7 + 7.6 = -5.1 dB
So it still follows the desired profile. Either you have run it for very few channel realizations or while computing the average, you did not averaged over the correct dimension. Did you run the same script as I provided and got these results?
Regarding normalization, see what happens if you add 5 replicas of the same signal without any normalization. The power would be 5 times the power of the input signal. An FIR filter effectively does the same things. It takes different delayed versions of the signal and adds them up with scaling. With this scaling, it is ensured that even after passing the signal through this channel, the signal power is preserved. But, still the difference between different taps should be the same as it is in dBs the ratio. Your ratio suggest something different,
-8.6 +2.6 = -6 dB
-10.7 + 8.6 = -2 dB
That is incorrect. Post your code if possible.
This comment has been removed by the author.
ReplyDeleteSir,
ReplyDeleteI understood what U said about factor M.
Thanks a lot for the explanation.
Yes, U r correct.I ran your Matlab code only for a very few channel realizations by keeping channel response N=100.(few hundred plus).
That s Y there is an Uneven power (dB)
difference between the consecutive taps as that of the original tap_weights_db.
1. If the channel realisation is too small. Y cant we get back the powerdb difference between the consecutive taps(as that of the original)? Is there any alternative method for small channel response so that power dBlevel difference of the consecutive taps is maintained inspite of delays?
2. Incase of Flat fading, Whether the no. of taps be only one(instead of many taps).[so that the Received signal r(t)= h(t)*x(t) which involves convolution becomes multiplication. & the channel gain (freq response of channel) be almost constant for the txmitted band of freq]
Whether that particular tap will occur at 0 microseconds (without any delay)!
Am i correct with this concept sir.
Please correct me if i am wrong in this regard.
Answers:
ReplyDelete1. These are statistical parameters. The larger the size of experiment, the more precise these statistical parameters are.
2. Yes you are right. For flat fading, use a single tap channel. Well, these taps doesn't actually occur at 0 microseconds. That would mean that the transmitted signal reaches the receiver at once without any delay although propagation through the channel has its own delay. These delays are relative to the delay of the tap to which demodulator synchronizes. In your case, you will say that the demodulator synchronizes to the first tap and thats why you can call it 0 delay tap.
Sir,
ReplyDeleteThank a lot for the detailed explanation.
In case of Flat fading as well as in frequency selective fading,
Whether the first tap_weight_dB will always be 0dB? (Since the Variance of the Rayleigh Random Variabe is 1)
Sir,
ReplyDeleteI have one more doubt.
Incase of AWGN channel,
The term Eb_N0_dB corresponds to the bit power over noise power. we might tend to deal the noise in the voltage domain (and not in the power domain). Hence to scale the noise voltage, we need to use
Eb_N0_dB_linear = 10.^(Eb_N0_dB/20);
Actually,We will be scaling the variance of channel h in accordance with the gain of the power delay profile.
My question is why should use
10^(-tapWeightdB/10) instead of
10^(-tapWeightdB/20) ?
by using Your Matlab code:
tapWtdB = [0 -5 -10 -15 -20 -25];
tap_weights_ln = 10.^(tapWtdB/10);
taps = 1/sqrt(2)*(randn(10^4,length(tapWtdB)) + j*randn(10^4,length(tapWtdB)));
taps_weights = taps.*repmat(sqrt(tap_weights_ln), 10^4,1);
z=mean(abs(taps_weights/sqrt(sum(tap_weights_ln))).^2);
c=10*log10(z);c
c =
-1.7076 -6.6634 -11.6258 -16.6208 -21.5983 -26.6602
by scaling tap_weights_ln by 20 instead of 10 and also removing sqrt term (one Normalization term)in the taps_weights & norm_fact line in the code
i got the answer like this:
tapWtdB = [0 -5 -10 -15 -20 -25];
tap_weights_ln = 10.^(tapWtdB/20);
taps=1/sqrt(2)*(randn(10^4,length(tapWtdB))
+ j*randn(10^4,length(tapWtdB)));
taps_weights = taps.*repmat(tap_weights_ln, 10^4,1);
z=mean(abs(taps_weights/sum(tap_weights_ln)).^2);
c=10*log10(z);c
c =
-6.9000 -11.9420 -16.9596 -21.9717 -26.9037 -31.9322
Which also give equal difference in power levels in the consecutive taps as you have mentioned earlier.
Correct me if i am wrong.
Waiting for your reply sir.
Thank you.
Well most of the times, the less distance your wave travel, the less attenuation it experiences. If the signal component that reaches the receiver earliest (the LOS component) is attenuated more than the reflected component, your first component will not be at 0dB. If you are asking about LOS component being stronger, that is represented by a ricean factor. I hope it answered your question.
ReplyDeleteYes you can do this like that. It is one and the same thing. Remember to change the following line too.
ReplyDelete% Calculation of normalization factor to make the average power of output
% signal to 1
norm_fact = sqrt(sum(tap_weights_ln.^2));
as now for calculating average power using sum method you need to explicitly square the linear tap weights.
In both of the cases you mentioned above, you didn't normalize the taps power so that they give an total average output power of 1.
This comment has been removed by the author.
ReplyDeleteThis comment has been removed by the author.
ReplyDeleteThis comment has been removed by the author.
ReplyDeleteSir,
ReplyDeletefirst of all sorry for troubling you.
For normalizing each tap weight :
1.Whether I need to divide the taps_weights by sqrt(sum(tap_Weight_ln)).
tapWtdB = [ -5 -10 -15 -20 -25];
tap_weights_ln = 10.^(tapWtdB/20);
taps=1/sqrt(2)*(randn(10^4,length(tapWtdB)) + j*randn(10^4,length(tapWtdB)));
taps_weights = taps.*repmat(tap_weights_ln, 10^4,1);
norm_each_tap_weight=taps_weights/sqrt(sum(tap_weights_ln));
norm_fact = sqrt(sum(tap_weights_ln.^2));
taps_norm = 1/norm_fact*norm_each_tap_weight;
z=mean(abs(taps_norm ).^2);
est_tap_weight_db=10*log10(z)
total_path_gain_of_channel=sum(mean(abs(taps_norm).^2,1))
o/p:
est_tap_weight_db = -2.4183 -7.5648 -12.4265 -17.3803 -22.4965
total_path_gain_of_channel = 0.8293
Here, the total path gain of the channel is close to one.(but the estimated tap weight
is more than the original tapweight(dB) )
2. (or)do I need to divide the taps_weights by sqrt(length(tap_Weight_ln)).
tapWtdB = [ -5 -10 -15 -20 -25];
tap_weights_ln = 10.^(tapWtdB/20);
taps=1/sqrt(2)*(randn(10^4,length(tapWtdB)) + j*randn(10^4,length(tapWtdB)));
taps_weights = taps.*repmat(tap_weights_ln, 10^4,1);
norm_each_tap_weight=taps_weights/sqrt(length(tap_weights_ln));
norm_fact = sqrt(sum(tap_weights_ln.^2));
taps_norm = 1/norm_fact*norm_each_tap_weight;
z=mean(abs(taps_norm ).^2);
est_tap_weight_db=10*log10(z)
total_path_gain_of_channel=sum(mean(abs(taps_norm).^2,1))
o/p:
est_tap_weight_db = -8.6703 -13.5813 -18.6063 -23.6805 -28.6429
total_path_gain_of_channel = 0.1991
Here, the total path gain of the channel is not close to one.(very less comparatively)
(but the estimated tap weight is close to the original tapweight(dB) ,ofcourse,
its value is less because of normalisation)
Please tell me which method to choose.
You have to do the method no.1. Actually, when you simulate a channel you usually go for the following methodology.
ReplyDelete1. Generate a transmitter of average signal power 1.
2. Pass it through the channel while preserving the power of input signal.
3. Add noise creating a signal of specified SNR.
For this, your power delay profile is always such that its first tap is at 0dB. All the other powers are relative to this first 0dB tap.
In your case, you are actually doing this. Creating a channel with power delay profile of [0 -5 -10 -15 -20] and then decreasing the power of complete signal. This difference in signal power can be handled when you add noise to it. So, in my opinion, you first create a PDP with reference to the strongest tap in the channel, and then make your SNR as much as you want.
Hope that answers your question.
Dear Ubaid
ReplyDeleteI am just waiting ur answer about my channel estimation.
I create a chananel in this way by using three taps.
%% MATLAB Code
x=transdata1; % BPSK
%----------------------Channel-------------------------------------------
taps=3;
p1=1;
p2=0.8;
p3=0.5;
gain1=sqrt(p1/2)*[randn(1,length(x)) + j*randn(1,length(x))];
gain2=sqrt(p2/2)*[randn(1,length(x)) + j*randn(1,length(x))];
gain3=sqrt(p3/2)*[randn(1,length(x)) + j*randn(1,length(x))];
n=1:length(x);
delay1=1;
delay2=2;
for n=delay1+1:length(x)
x1(n)=x(n-delay1);
end
for n=delay2+1:length(x)
x2(n)=x(n-delay2);
end
transdata=gain1.*x+gain2.*x1+gain2.*x2;
%------------------------Addition of noise -------------------------------
noise = 1/sqrt(2)*[randn(1,length(x)) + j*randn(1,length(x))]; % Noise
snr = [0:10]; % multiple Eb/N0 values
ps=mean(abs(x).^2); % Power of the transmitted signal
for i = 1:length(snr)
y = transdata + (sqrt(ps)*10^(-snr(i)/20))*noise; %Addition of Noise
I produced one sample delay between each tap.
Now how I equilize this on receiver.
Well the answer to this question "how I equalize this on receiver" needs a complete chapter. There are many methods available. Just to give you an example, send a training sequence and estimate the channel response using any of Zero Forcing or Minimum Mean Square Error estimators. Now after you have the channel response, convolve this channel response with the rest of your signal. This is one-shot equalization. Alternatively, you can go for adaptive algorithms too if the symbol/burst interval exceeds coherence time. I would recommend you to study any undergraduate text such as of Bernard Sklar or Wireless Communications by Andrea Goldsmith; more specifically their chapters/articles on channel equalization.
ReplyDeleteIf you have some specific question, please mention it clearly.
Thanks for ur reply.
ReplyDeleteI made zeroforcing equlization for on Tap
rx0=recdata.*conj(gain1); %Zeroforcing Equalization
where recedata= fadded data
gain1= Channel
but if i include second or third Tap how can I get the overall channel response which i can use for zeroforcing.
Please refer some simple stuff to under stanf equilazation for frequency selective channel for multicarrier modulation.
Thanks.
I think you want to take inverse of the channel response. An easy approach is,
ReplyDeletechannel_fft = fft(channel, N)
inv_channel_fft = ifft(1./channel_fft, N);
convolve this inv_channel_fft with your fadded data for single carrier case.
for multicarrier case you can use the 1./channel_fft for multiplication with faded data of the same FFT size as N.
Dear Thanks for ur reply.Yes initially i am using simple method just inversing the channel. But when there is one tap it is easy to just inverse the gain of this tap(channel).But now I have two taps with diffferent gains and one sample delay between them.How can i combine these two taps two make overall channel.
ReplyDeletex=transdata1; % BPSK( mc-cdma WITH FOUR SUBCARRIER)
taps=3;
p1=1;
p2=0.8;
gain1=sqrt(p1/2)*[randn(1,length(x)) + j*randn(1,length(x))]; % gain of Tap 1
gain2=sqrt(p2/2)*[randn(1,length(x)) + j*randn(1,length(x))];% Gain of Tap 2
n=1:length(x);
delay1=1;
for n=delay1+1:length(x)
x1(n)=x(n-delay1); % producing delay of one sample between two taps
end
%Now I have two signal
%X= no delay
%x1= one sample delay
%Is it correct to do this:
transdata=gain1.*x+gain2.*x1;
%------------------------Addition of noise -------------------------------
noise = 1/sqrt(2)*[randn(1,length(x)) + j*randn(1,length(x))]; % Noise
snr = [0:10]; % multiple Eb/N0 values
ps=mean(abs(x).^2); % Power of the transmitted signal
for i = 1:length(snr)
y = transdata + (sqrt(ps)*10^(-snr(i)/20))*noise; %Addition of Noise
Whatever the number of taps are, you can use the method I mentioned in previous post. In your case,
ReplyDeletechannel_fft = fft([gain1 gain2], N);
Now if you are using multicarrier modulation with FFT size N, you can use the 1./channel_fft to equalize it. For single carrier, you can take IFFT of the channel_fft.
inv_fft = ifft(channel_fft, N);
now convolve this inv_fft with your signal. When you number of taps increase, just grow the vector [gain1 gain2 ...].
AOA
ReplyDeleteThanks ; according to ur guaidance i made like this but can i add the two different signal with delay of one sample or another method.
x= transmitted data;
taps=2;
p1=1;
p2=0.8;
gain1=sqrt(p1/2)*[randn(1,length(x)) + j*randn(1,length(x))];
gain2=sqrt(p2/2)*[randn(1,length(x)) + j*randn(1,length(x))];
channel_ifft=ifft([gain1,gain2],length(x));
n=1:length(x);
delay1=1;
for n=delay1+1:length(x)
x1(n)=x(n-delay1);
end
%transdata=gain1.*x+gain2.*x1;
transdata=channel_ifft.*(x+x1);
%------------------------Addition of noise -------------------------------
noise = 1/sqrt(2)*[randn(1,length(x)) + j*randn(1,length(x))]; % Noise
snr = [0:10]; % multiple Eb/N0 values
ps=mean(abs(transdata).^2); % Power of the transmitted signal
for i = 1:length(snr)
y = transdata + (sqrt(3*ps)*10^(-snr(i)/20))*noise; %Addition of Noise
%-------------------------------------------------------------------------
%--------------------------Receiver ---------------------------------------
recdata=y;
L=length(y);
rx0=recdata.*1./(channel_ifft); Equilization
what does that mean? two signals? you mean a signal and its delayed version. that depends on what you are modeling. if you are simulating multipaths for sure you can add them even if they are not sample spaced..
ReplyDeleteYes two version of signals.
ReplyDeletex= Tap 1 signal with no delay
x1= Tap 2 signal with one sample delay w.r.t x
I have to add these two and then passes through channel: like this
gain1= Tap 1 gain
gain2= Tap 2 gain
channel=ifft([gain1,gain2],length(x));
signal_fadded= channel.*(x+x1);
is it correct:
channel=ifft([gain1,gain2],length(x));
ReplyDeletesignal_fadded= channel.*(x+x1);
why are you taking the IFFT of the channel taps?
Hi Ubaid,
ReplyDeleteI am trying to work on an OFDMA subcarrier allocation, and therefore require to model a Rayleigh fading channel.
can you tell me how i can modify your codes to make them for an OFDMA signal with K users and N subcarriers
many thanks
Amir
@Amir
ReplyDeletewell there is no difference in the channel modeling at all and you will change your transmitted signal only. As i suspect, you are simulating some sub-carrier allocation algorithm, it is not the channel that needs to be changed. The channel remains the same physically as well irrespective of the structure of transmitter and receiver. Besides, one more difference can be the multiple access interference that will be present in this environment and you may or may not wish to simulate it. But, that too will not change the channel model. In summary, if you want to simulate almost any transmitter-receiver on some PDP that has sample spaced delays, the above written code is sufficient.
[FROM EMAIL]
ReplyDeleteAsslam Aliukm Ubiad,
My name is Khalid, and I am graduate student doing research in OFDM area.
I read you article on "http://dspdotcomm.blogspot.com/2008/11/simulating-sample-spaced-rayleigh.html" which is titled as "Simulation Sample Spaced Rayleigh Channel".
Actually I am working on OFDM synchronization. I tried many times to generate the figure number 3 in the attached paper which represents the mean square error (MSE) of timing offset in OFDM system.
I think I have problem with the channel itself but I could not figure it out.
I tried your code also by convolving the input signal with the "taps" in your code. However, i did not get the correct answer or figure.
I attached the paper just to know what I am talking about. Also I attached an m-file which has the code so you can tell me what I am doing wrong.
I am really stuck in this fore weeks now so any help or hints are really appreciated. thanks in advance.
Best Regards,
Khalid,
clc
clear all
close all
%--------------------------------------------------------------------------
N=64;
GI=N/4; % guard interval
tau=0:2:8; % arrival time of each path in seconds
pdb=linspace(0,-24,length(tau)); %power of each path
delay=zeros(N/8,1);
delay_value=GI+1; % beacuse we need to synchronize with the first sampele after the guard interval period.
chan=rayleighchan(1,0,tau,pdb); % generating of Rayleigh channel
start_snr=0;
step=5;
end_snr=20;
%--------------------------------------------------------------------------
% BPSK modulator and Demodulator
hMod = modem.pskmod('M', 2, 'InputType', 'bit');
hDemod= modem.pskdemod(hMod);
count1=1;
for SNR=start_snr:step:end_snr
for count2=1:1e2;
%--------------------------------------------------------------------------
park_n_bits=(N/4);
park_h=seqgen.pn('Shift', 0);set(park_h, 'NumBitsOut', park_n_bits);
park_bits=generate(park_h);
c=modulate(hMod,park_bits);
C=ifft(c); % forming only one part of the four parts of Park's preamble. The other three parts can be generated from the it.
CC=[C;C(end:-1:1);conj(C);conj(C(end:-1:1))]; % Park's preamble
Ppark=[CC(end-GI+1:end);CC;delay]; % appeand the cyclic prefix at the begining as guard interval
snpark=filter(chan,Ppark);clear Ppark
reset(chan)
Ppark=awgn(snpark,SNR,'measured');
L=N/2;
for d=1:size(Ppark,1)
Mpark(d)=(abs(sum(flipud(Ppark(d:d+L-1)).*Ppark(d+L:d+L+L-1)))).^2./sum((abs(Ppark(d+L:d+L+L-1))).^2).^2;
if d+L+L==size(Ppark,1), break;end
end
[p_park,i_park]=max(Mpark);clear Mpark
e_park(count2)=(delay_value-i_park);
end
E3(count1)=mean(e_park.^2);clear e_park
count1=count1+1;
end
SNR2=start_snr:step:end_snr;
semilogy(SNR2,E3)
@khalid
ReplyDeleteCheck this code first on two cases
i). For AWGN only. Dont bypass the filtering operation. Choose the taps as b = [ 0 0 1 0 0 ] and a = 1 (accommodate the group delay of this filter i.e. 2 in your "actual timing" point).
ii). Append some zeros or noise of very low power in the beginning of the data that is input to the channel filter.
Your algorithm should work in both of the cases. If it doesn't produce the same and correct output, the algorithm is not coded rightly. If the code passes all of the above tests, we can see further into the code.
I tried two cases:
ReplyDelete1) taps delay, b = [0 0 1 0 0]
2) taps delay, a = 2;
Unfortunately the results are not the same!
Hello Ubaid,
ReplyDeleteif I want to use your code, Should I just convolve my OFDM symbol with "taps" in you code to get the received faded symbol?!
@khalid
ReplyDeleteYou can use my code in the case your taps are sample spaced. You must know the sampling rate of the transmitted signal. For example, when we say that the 2nd tap of the channel is two samples away that means the path delay of the 2nd tap is 2xsampling period of the transmitted signal. To support a certain data rate, you must end up with the sampling period/ sampling rate at which you have samples of your transmitted data. Then use this sampling rate to produce your desired channel profile in terms of sample spaced channel profile. After generating these taps relative to this particular profile, you can use filter command to simulate the channel.
filter(taps, 1, transmitted_signal)
[ANSWER TO YOUR EMAIL]
you must first check the results in the cases i asked you. I gave you the taps values, not the path delays as you commented above. So use the following call.
filter([ 0 0 1 0 0], 1 , transmitted_signal);
and now change the actual sampling point to cater for the group delay of this channel i.e. 2. For example, if your actual sampling point (known to you) is 17, for this channel it will become 17+2=19. Now compute the results and plot them. Does it work? Does it go to zero error for large SNR? Because, if your code doesn't work for this simple delay-channel, it will certainly not work for complex multipath channels. Your timing synchronization should be able to determine the start of burst correctly.
Another thing to mention is, when you create rayleigchan or ricianchan object in MATLAB toolbox, look for the property ChannelFilterDelay. This property tells you what delay is introduced by the channel filter and this should be considered in calculating the 'actual' timing point. In your code, delay_value should include this delay too. If you dont include this, there will always be a constant difference between your computed timing point and your 'actual' timing point; even at higher SNRs.
Good Luck!
@khalid
ReplyDeleteWhich channel profile you are using for your simulations or/and the paper-guy used in his simulations? Write in terms of path delays and tap values!
Thanks Ubiad. I will work on my code again based on your notes above.
ReplyDeletefor simulation part, The paramters are:
1- Rayleigh channel with exponential power delay profile.
2- All channels have 4 taps with equal tap spacing of two samples.
3- The ratio of the first fading to the last fading tap is set to be 24dB.
4- Doppler frequency is 50 Hz.
5- Carrier frequency is 5GHz.
Hello Ubaid,
ReplyDeleteMy name is Fidan. I've read your article about simulating sample spaced rayleigh fading channels. You've given great explanations.
I am trying to do some simulations about OFDM channel tracking. But, I've a problem with modelling the channel with the following characteristics: All the channel taps (6) are sample spaced and do not fall in between 2 sampling instants. Further, each tap is generated using the randn function and for fading the Jake's model should be used. You may take the values of tap delays arbitrary, of course taking into account they are sample spaced, and also the values of average power of taps.
How can I write this in Matlab? Please help me.
Best regards,
Fidan
Thanks Fidan!
ReplyDeleteI think the only difference between what you want to do and what i have already done in the MATLAB script is that you want your channel to follow Jake's Doppler spectrum as well. For this a simple method (thats part of MATLAB's communication toolbox as well) is to pass the channel taps through a filer that has frequency response equal to square root of the doppler spectrum. So, just generate the channel taps as outlined above and filter them through this 'doppler spectrum filter'. For further information, read the following white paper.
http://www.mathworks.ch/matlabcentral/fileexchange/18869
After you have generated the taps, design a tapped delay line based channel filter using path delays of your channel PDP. For example, if your have the following profile,
taps = [a b c d]; % tap values at any instant
dely = [1 2 4 7]*1e-6; % in micro seconds
t_symb = 1e-6 % symbol interval in micro seconds
filt_resp = [a b 0 c 0 0 d];
pass your signal through this filter using filter command
chann_out = filter(filt_resp, 1, your_signal);
Hope that helps..
This comment has been removed by the author.
ReplyDeleteThis comment has been removed by the author.
ReplyDeleteHi Ubaid,
ReplyDeleteFirst of all I must thank you for such a detailed post on Channel model. I believe this is best post I have come across on Fading delay profiles.
I am trying to generate taps for a fading profile with parameters as below
Tap
number Relativetime(µs) AvrgeRelativepwr(dB)
1 0,0 0,0 RICE
2 0,2 2,0 CLASS
3 0,4 10,0 CLASS
4 0,6 20,0 CLASS
I could generate MATLAB code for CLASS Doppler spectrum but am struck on
1)How to rate match the tap rate (1/2 micro sec = 500Khz) to data symbol rate of Y Micro secs?
Can I directly upsample(add zeros) and proceed? Is this the correct way?
i.e. How to keep both Channel model delay profiles in sync with the data Symbol rate?
2)How is "AvergeRelativepowr" different from Relative Power?
I could not find much useful info on googling in this regard.
Thanks
Shilpika
Also
ReplyDeleteu have mentioned that "assuming sample spaced taps, we will have to input the waveform samples (that comes out of the transmitter) with the same sampling interval as that of the time interval between the FIR channel taps."
The Samples from Tx are modulated, so we get symbols - Am confused here, how do I look at symbols per sec and sampling interval of FIR channel filter?
@Shilpika
ReplyDeleteI couldn't understand the channel profile you have given? According to this the first tap has two relative delays and corresponding powers?
Rate Matching: That depends on the channel profile you are using. For example, if the channel tap spacing is sample spaced i.e. the channel taps are spaced in integral multiples of sampling interval of signal, you can simply add the zeros in the channel taps.
In case, your channel taps are not sample spaced, you need to perform simulation on some intermediate sampling interval that will make the channel profile sample spaced. But this is an inefficient method of doing so. A better approach to model a frequency selective channel with variable delays is to use equivalent uniformly spaced channel model. For more information on this, refer to Section III-B: "Time Spreading Simulation: Bandlimited Discrete Multipath
Channel Model" of the following document.
http://www.mathworks.com/matlabcentral/fileexchange/18869
Average Relative Power & Relative Power: The channel profiles are based statistical parameters and not on the instantaneous values. Relative power usually means the instantaneous relative power of the tap that may be different from the channel profile. For example, in above simulation, when you look at the channel taps of any channel realization, you will see that values do not totally comply with the channel profile. But, if you average them on a long run, the average values of the relative powers become equal to your desired profile. In summary, average power is a statistical parameter where as relative power is an instantaneous value.
@Shilpika
ReplyDeleteYou can take it this way. Your channel doesn't know what is at its input i.e. whether it is modulated data or noise or anything. All it knows is that the input is being sampled at a particular frequency. That is why i did not use symbols (modulation specific parameter) and used samples instead. For example, you have a BPSK modulator with symbol rate 30 kbps. Now, since BPSK uses 1 symbol per bit its symbol rate is the same i.e. 30 kSymbols per second. When this is passed through the transmit filter, it upsamples it with a ratio let's say 4. So, now the sampling rate of your BPSK modulated data is 30k x 4 samples per second. You should design your channel on this sampling rate and not on your symbol rate. Hope that answers the question.
Hi Ubaid,
ReplyDeleteThanks for your response.
The chanel parameters are
number Relativetime(µs) AvrgeRelativepwr(dB)
1 0,0 -10.0 CLASS
2 0.1 -8.0 CLASS
3 0.3 -6.0 CLASS
4 0.7 -4.0 CLASS
5 1.3 0.0 CLASS
6 15.0 -4.0 CLASS
and so on... .
"," indicates a decimal point in my previous post.
I have already gone through the matlab central document but I could not make much out of it. The equations scared me. Can you please brief it in terms of implementation if it doesnot eat too much of your time.
Also, Assuming sample spaced taps, I should implement the output signal as double integration of delayed version of the i/p signal and Dopler spectra and exp(2*pi(f*T)) - equation from page 129, Annex C, 3gpp spec 45.005. I am totally struck here trying to understand a way to implement it in MATLAB. Can u help me give a push in this regard.
Hi Ubaid,
ReplyDeleteAm working to Simulate a Fading Channel model with Ricean Doppler spectrum
I could not clearly understand if the LOS component in RICEAN model is a constant value in time domain or is time variant.
Because on adding the LOS component, the PSD looks in its typical U shape if LOS is time variant, else it looks like a spike at 0 if LOS is a contant value.
Can you please explain. I can post my code if u demand.
Thanks
GV.
Hi Ubaid,
ReplyDeleteGoing through ur code , I have a question in mind
The line
norm_fact = sqrt(sum(tap_weights_ln));
Can also be written as
norm_fact = sqrt(sum(taps_weights)); ??
and 1/sqrt(2) can be ignored(optionally) by doing the above line . Am I correct?
-Kuhu
@Anonymous - [Hi Ubaid, Thanks for your response...]
ReplyDeleteWell even with my help, it wont be a heaven :) Still I try to make it as easier for you as it can get. All you need to do is to go the following web page.
http://www.mathworks.com/access/helpdesk/help/toolbox/comm/index.html?/access/helpdesk/help/toolbox/comm/ug/a1069449399.html#bq5zk36
You have your channel profile from which you can get ak of equation Equation 1 (Remember, my code is meant to produce these ak 's ). Now, use the same equation to calculate gn 's that will be used in the equation Equation 2. In case of sample spaced channels, you were able to use these ak 's and had no need of calculating gn 's. With the variable delay channels, you need to convert these ak 's into gn 's first and then use these gn 's in the FIR filter. These gn 's are sample spaced with the sampling frequency 1/Ts. Keep in mind the note about choice of this sampling frequency in the end of this article.
[Annex C, 3gpp spec 45.005] - I am totally lost here. If you have difficulty in just implementing an equation, refer to the equation on some website or document.
@Anonymous - [Hi Ubaid, Am working to Simulate a Fading Channel model ...]
ReplyDeleteLOS component is always a constant value added to the taps.
Ricean Taps = LOS Component + Rayleigh Faded Taps
In above equation, LOS is a constant value and a constant value added to time variant Rayleigh Faded Taps result in time variant Ricean Faded Taps.
In case you are asking if it should show a spike or not the answer is yes it should. If you wanted me to explain anything else, write your question in detail and post your code if it relates to your question.
Hi Ubaid,
ReplyDeleteU can call me GV. In my previous post I asked about Los component.
Below is my code on LOS component added to Jakes model.
Here is my code
%Filter taps in Number
xt = 128;
% Parameters for Channel A
%Td=[0.0, 0.25,0.5,1.0,1.9,2.2]; % time delays (in microsec)
%PdB=[0.0,-1.0,-9.0,-10.0,-15.0,-20.0]; % Powers (in dB)
%K=[0,0,0,0,0,0]; % Ricean Factor
% Parameters for Channel B
Td=[0.0, 0.25,9.0,13.0, 17.0, 20.0]; % time delays (in microsec)
PdB=[-2.5,0.0,-12.8,-10, -25.2, -16]; % Powers (in dB)
K=[0.5,0.5,0,0,0,0]; % Ricean Factors
Td=Td*(10^(-6)); % time delays (in sec)
nd=round(Td*Fs); % time delay in samples
P=10.^(PdB/10); % Powers (Linear)
for k=1:length(Td)
g=jakes(Fd, Fs, Np);
s=sqrt(P(k)/(K(k)+1)); % random path
m=sqrt(P(k)*K(k)/(K(k)+1)); % direct path
Los = m*exp(j*2*pi*Fd/Fs*(0:length(xt)-1));
Final=s*g+ Los;
end
1) My Qs is should not PSD of 'Final' look like a typical 'U shape' and not a spike ?
2) I am getting spike :( and if I make
Los = m* real(exp(j*2*pi*Fd/Fs*(0:length(xt)-1)))
I can see Final has 'U' shaped PSD. Why is this?
3)I see in MATLAB demos the shape is 'U'.
Thanks
GV.
Hi..
ReplyDeleteGv here...
My third Qs is
3)I see in MATLAB demos the shape is 'U'.
In Frequency Domain, Los is a delta function, so in time it is Exponential and I used (exp(j*2*pi*Fd/Fs*(0:length(xt)-1))) as Los component in time domain.
It is over range 0:length(xt)-1). Does this not imply, it is varying over time.?
4)Thinking LOS is constant over time,
I made my code as
Los = m*exp(j*2*pi*Fd) %no time variable
Final = s*g + Los;
And now Final is always a spike and not U.
Hi Ubaid,
ReplyDeleteI want to know the values of filter coefficients of Classical, Rice and Rayleigh channel model to crosscheck my simulator values.
I could not get the exact values from net.
1)Can u help me find a link to these values?
So I passed an impulse to stdchan of type 'hiperlan2A'. But the values doesnot seem to match filter coeffs I created.
2)Is this the corect way?
I even tried passing other 'chantypes' which has the above said Doppler distributions.. but in vain.
Below is my code
input = repmat(1,1,1000);
delta = inline('n == 0');
del = 0:1:1000;
Delta = double(delta(del - 0));
fd = 100; fs = 16*fd; ts =1/fs;
mychan = stdchan(ts,fd,'hiperlan2A');
y1= filter(mychan,input);
y2 = filter(mychan,Delta);
plot(abs(y1));
figure
plot(abs(y2));
Thanks
Kuhu
@GV
ReplyDelete1) Lookup in the MATLAB documentation for Fading channels. You will find the following
"It is possible that a multipath channel (e.g. a Rician channel) can
have both specular (line-of-sight) and diffuse components. In such a case,
the Doppler spectrum would have both a line component and a wideband component.
The channel visualization tool only shows the wideband component for the
Doppler spectrum."
So if you are using channel visualization tool, it will not show you the LOS component in the diagram.
2). What is the link between doppler frequency dependant exponent and line of sight component? The only thing that dictates LOS component is the Ricean K-factor. You should use the K-factor to determine the tap-value amplitude and then add it to the rayleigh distributed tap values.
3). MATLAB will not show the LOS component in PSD.
4). No! LOS is not a delta function in frequency domain. LOS represents a constant tap value in the channel impulse response.
Hi Ubaid,
ReplyDeleteGv here..
1)I cud understand that LOS is a constant value, and diffused components have PSD of U shape.
Now, if I add both final =LOS + diffused, Am not clear how should PSD of final look like?!!!
as per 3GPP spec 05.05,Annex C
S(f) = 0.41/(2pifd(1 -(f/fd )2 )0.5 ) + 0.91 delta(f - 0.7 fd )
So LOS -->> 0.91 delta(f - 0.7 fd ), K= 0.91/0.41
2)So is it not that LOS is delta in Frequency domain and hence exponent in Time domain?
Hello Ubaid,
ReplyDeleteWhere is sampling frequency( = N*fd) of the Rayleigh channel coefficients used at all in the whole delay profile simulation?
Hi Ubaid,
ReplyDeleteGoing through ur article and the answers to the Qs asked, I appreciate ur patience.
I think I have similar Qs as the above post.
Each multi path is characterised with a set of filter coeffs,( in ur case 1024), say M.
These filter coeffs are sampled at a frequency N*fd.
So, M filter coeffs each of path P1, P2, P3 ,P4 are sampled at N*fd hz.
Now let P1,P2,P3 ,P4 multi paths are spaced at S = 1Micro sec .
How are these two kept in sync? S= 1 micro secs and (1/N*fd)secs.
Awaiting ur reply...
Hello Ubaid,
ReplyDeleteI am working on modelling channel model with Jakes Doppler spectrum.
Your code was very helpful for me to proceed.
I have a question on the sampling rate of Jakes filter coeffs.
My Jakes filter is sampled at 16*Fd, where as my system input rate is Ts.
Now I resampled my Jakes coeffs such that they match input sample rate of Ts, so the coeffs are spaced at Ts seconds.
But!! Now comes the question for the delay these filter coeffs are introducing !!!
I have 128 coeffs, spaced at Ts seconds. Once I pass my input samples thru my Jakes filter, the output comes after 128*TS seconds, which is in the order of milli seconds.
I think the delay in milli seconds is verrrrry high. How do I reduce the delay introduced by my filter coeffs???
Thanks in advance!
@GV
ReplyDeleteIn your previous post, you have written 'Frequency Response' and not the PSD that means the frequency response of the channel. In the frequency response, it is not a delta. When viewed in PSD, the delta or the spike appears as suggested by the standard. But as I already said, you will not observe this spike if you use the channel visualization tool of MATLAB.
@shilpika
ReplyDeleteThere is no need of any sampling frequency in the above simulation as we want to model only different channel realizations. These different channel realizations are totally independent of each other and the PSD is white. The sampling frequency you are talking about (assuming fd stands for maximum doppler frequency) comes into play when we are modelling fading channel with a correlation between different channel realizations. This definitely occurs when there is a relative movement of TX,RX or stuff in the environment. In above simulation, the only use of sampling frequency is to tell us if the channel is sample spaced or not.
@neema
ReplyDelete"Each multi path is characterised with a set of filter coeffs,( in ur case 1024), say M.
These filter coeffs are sampled at a frequency N*fd"
No in above simulation the filter coeffs are not sampled at N*fd. There is no doppler frequency used in this case as we are modelling only different realizations of the channel. You can think of it like an experiment in which you want to know how your system behaves when it experiences different states of the channel provided the taps are rayleigh distributed. When you pass your signal through this channel, this channel doesn't change and behaves as static channel. When doppler frequency comes, with every input sample, the channel taps are changed according to the doppler frequency. So there we need to take care of sampling frequency as we want the set-2 of channel taps related to set-1. In above simulation, two sets of channel taps are totally independent.
"Now let P1,P2,P3 ,P4 multi paths are spaced at S = 1Micro sec .
How are these two kept in sync? S= 1 micro secs and (1/N*fd)secs."
In above simulation, you dont need to do this. Let us suppose you extend this code to simulate a channel with specific doppler spectrum. In that case, you will use interpolation/decimation techniques to keep them in sync. Besides, you may have to use equivalent uniformly spaced model for channel with variable delays.
Sir Ubaid Abdullah
ReplyDeleteMy name is Shanar, I’m working on wimax PHy layer, I want to change the channel between the transmitter and the receiver form (AWGN) to (SUI 3 ) using matlab2008 simuling. I have the value of each taps put I can't use it, I stuck with this problem for 10 weeks, I'm asking your aid, Could you please show the way to that.
@Shanar
ReplyDeleteIf you have communication toolbox installed, all you need is to call the rayleighchan function. Besides, be specific what exactly is bothering you while simulating SUI-3?
I have the value of each taps put I can't use it, I stuck with this problem for 10 weeks
Can't use it. What does it mean? And what exactly is the problem you are stuck with?
Mir Ubaid Abdullah
ReplyDeleteThank you very much for your e-mail, sorry for being late but I was practicing the model and how to solve the problem.
Basically I’m research student working on WiMAX PHY layer in using matlab2008 software with communication toolbox, as you know, its consist of three parts, transmitter, receiver, and channel between them, in the standard model the communication channel between the transmitter and receiver is multipath fading channel with AWGN, that what is already exist in the software.
My problem which I don’t know how to solve it, is how to use one of the Stanford university interm (SUI) channels in wimax simulik instead of the existing channel then run the PHy layer in simulink then plot the result using bertool.Please be patient with me because I don’t have good knowledge in this topic.
I attached picture for the Wimax PHY layer which exist in matlab2008 with SISO technique.
Thanks for your time.
@shanar
ReplyDeleteI dont have MATLAB2008 but still I try to explain how you can configure your channel to SUI-3 for the demo in MATLAB2007.
1. Double click on the multipath channel block and select fading mode to dispersive fading.
2. Right click on the multipath channel block and select Look Under Mask.
3. Locate two Rayleigh Fading blocks. Now open both of the blocks by double clicking them and locate the one in which Delay Vector(s) has the parameter value [0 chanSamplePeriod]. Replace it to the delay vector of your desired channel such as SUI-3. For example, if the delay vector is [0 1e-6 2e-6] that means your channel has three taps with relative delays of 0, 1 and 2 microseconds.
4. In the Gain Vector(s) property, write the gain vector of your channel. For example, a gain vector of [0 -5 -10] describes that the channel taps have relative gains of 0, -5 and -10 dB.
Now, save this and simulate it. You can find SUI-3 profile on internet very easily.
@Anonymous
ReplyDeleteHello Ubaid,
I am working on modelling channel model with Jakes Doppler spectrum...
You can calculate the group delay of the filter and remove the first N = [group delay of your filter] samples. But why do you need it?
Sir Ubaid Abdulla
ReplyDeleteMany thanks to you for helping me and for being patient with me, finally I can say I did it with your aid of course, but I have some question in my mind I need to ask you, I organised them as a points, so let me say them:
1- You mentioned that, there are two Rayleigh fading block inside multipath channel block and this is true, but my question is shall I change one of them with new SUI channel value or both of them have to change to get the desired channel result?
2- How can I know that I’m doing the simulink for the model in proper way? Is there any method to check that?
3- I upload three pictures; first one is for SUI3 profile which I want to implement it and what is the meaning of K factor? Does it mean the gain in each tape, second picture for the Rayleigh fading block parameters inside the multipath channel, to be sure that I use that parameters properly, third picture for the model after implementing the SUI channel to see the result?
4- Finally, I came cross Negative value for (SNR ) panel in the model while running simulation in some cases, just I want to be sure is it possible or not negative value in SNR screen monitor?
Thank you indeed sir, you did very big favour for me.
@shanar
ReplyDeleteAnswers to your questions in the order they are asked.
1. Locate the one in which Delay Vector(s) has the parameter value [0 chanSamplePeriod]. Replace it to the delay vector of your desired channel such as SUI-3.
2. You have to find the research papers in which people have done similar work. Try ieeexplore!
3. k-factor describes the ratio of dominant component power to scattered components. Read a basic text to get detailed insight such as Wireless Communication by Andrea Goldsmith or Wireless Communication by Rappaport. In rayleigh channel, k-factor is 0. So, you dont need this parameter for this simulation. By the way you have not given the actual value of path gains in the screen shot. Write the path gains not the k-factors in that text box.
4. Yes if your channel has a deep fade, it is possible to have very poor SNR. I dont know if in the monitor you are having actual value of SNR or estimated one. In case of estimated SNR, it can be a wrong estimation itself.
Many thanks Sir Ubaid
ReplyDeleteDear sir Ubaid
ReplyDeleteI couldn’t understand two things in your replay:
First one is, what do you mean by the path gain or the gain victor and how can I find it in the SUI parameter table that I send it to you, and where can I put it inside the Rayleigh block to simulate the wimax model under SUI channel ?
Second question: what is the difference between the actual SNR and the estimated one? How can I know which one I use?
May thanks for your time and help sir.
Hi Ubaid,
ReplyDeleteIn the link http://www.mathworks.com/access/helpdesk/help/toolbox/comm/index.html?/access/helpdesk/help/toolbox/comm/ug/a1069449399.html#bq5zk36
Can yu please explain step 3: "The filtered complex Gaussian process is interpolated so that its sample period is consistent with that of the input signal. A combination of linear and polyphase interpolation is used."
How do we know the sampling frequency of "complex Gaussian process" and " Doppler filter " ???
-Shilpika
@shanar
ReplyDelete1. path gains show how weaker/stronger different taps are relative to some particular tap (usually the LOS path). you need to study some text for details its hard to wrap it up in a single comment. Try wireless communications by Rappaport.
2. In simulation, there is an SNR that you put in the channel profile. This is what you know as you are simulating it yourself. In order to make your receiver know about it, you need to estimate it using the received signal. Thats what we refer to as estimated SNR.
@shilpika
ReplyDeleteIts sampling rate is same as that of input sample rate. Consider your channel as an FIR filter. When the first sample is input to the channel, it has a set of taps as A. Now when the next sample enters into the FIR filter/Channel, the filter has a new set of taps lets say B. Now, as you see we need to know the channel response at sampling intervals of the input signal i.e. we should know channel taps A and B that are one sampling interval apart (generally we need to know channel at time t=nT where T is the input sampling period, and n is 0,1,2 ...) When we know these channel responses, we use them one by one as channel taps with each sample input. Thus, the filtered Gaussian process has to be sampled at the input sampling rate so that the resulting taps can be simulated on input signal.
Many thaks sir Ubaid, I got the desire book and i will read it.
ReplyDeleteSir Ubaid
ReplyDeleteHello again, I have got the “Wireless Communications” book by Rappaport and I read most of it, it was very useful for me to know the basics of communication field.
I came up with new questions for you, as I mentioned before I ‘m working on WiMAX Phy layer and my research regarding to implementing SUI-3 channel model on both wimax existing model with (SISO& MISO) using Matlab Simulink as a software to do so.
Farther for our discussion, let me tell you what I have done, first I opened multipath channel block and I selected dispersive fading, second I allocated the Rayleigh channel which its Delay Vector(s) has the parameter value [0 chanSamplePeriod] I replaced it with SUI-3 Delay parameters, Third I did the same with the gain vector and I but the new value for it, finally I put the value for Maximum Doppler shift, as you can see from the attached picture. Please correct me if I’m wrong?
I have to question for you:
1- In the SUI channel profile there are three Doppler value(0.4 0.3 0.5) each one for different taps, which one shall I put it inside Rayleigh parameter ?
2- There are some parameters in SUI profile that I didn’t use them while running simulation such that (Antenna Correlation, Gain Reduction Factor, Omni antenna, Overall K) is there any other place shall I slot them in?
A Big thanks for you sir.
SNR vs. BER
ReplyDeleteDear Ubaid
How are you doing? I came up with new question, waiting your for answer with respect, I could plot the relation between Eb/No Vs. BER, right now I need to know how can I draw the relation Between SNR and BER(SNR Vs. BER)? Shall I send the SNR data to Matlab workspace as a variable then plot it regarding to BER variable using plot (x,y) function ? If it is so how can I find the value for SNR variable and which SNR shall I use real or estimated one, if I’m wrong show me the right way to do that please ? I’m waiting your answer impatiently, Many thanks in advance.
Take care
The relationship between SNR and EbNo is modulation dependent. So, without knowing your modulation scheme i cannot comment on their relationship.
ReplyDeleteYes you can use plot command but as BER decreases very quickly, it is more convenient to plot BER/SNR curves with BER in log units. Use semilogy berfit instead for this. You should use real SNR.
Dear Ubaid
ReplyDeleteI’m very thankful to you, but I still facing some problems in my work, so please give me your patient,
As you know wimax system use adaptive modulation technique in downlink and you know that I’m using existing model in matlab 2008 software. In that model forward error correction (FEC) contain all modulation types together, so when I want to draw the BER for the model I draw it for all these modulation together, What I don’t understand it is how to plot the different modulation types in different curves , as in this attached picture which I uploaded to you? If you don’t have this model you can explain it regarding to 802.11 existing model in earlier matlab version which is also using adaptive modulation technique.
Uploaded pictures
1-BER vs. SNR plot for different coding profiles on SUI2 channel.
2- IEEE802.16-2004 in matlab.
3- Inside FEC
Hi Ubaid
ReplyDeleteI'm Michael and i'm working on GSM simulations. I've got the channel profile TUx from Annex C, 3gpp spec 45.005 and i use rayleighchan function to model the channel.
To determine the FIR coefficients, i filter a dirac signal with the channel:
dirac = zeros(1000,1)
dirac(1) = 1
h = filter(chan,dirac)
Why the h's length is different from the number of taps (i used the 6-taps TUx) ? And what do chan.PathGains stand for ? Is it the FIR coefficients ?
Thanks for your help.
How have you defined your channel? Write the command you have used. It is likely that you have used incorrect sampling rate specification in your rayleighchan definition. In most of the cases it will be different. The h-taps are sampled spaced with the time interval between them equal to the sampling rate of dirac delta function (that is equal to the one you have specified in your rayleighchan profile). While, your channel may or may not be sample spaced i.e. the delay difference between two taps is not necessarily an integral multiple of sampling interval.
ReplyDeleteFor example, consider the following channel profile.
tap 1 , 0 db, 1 usec
tap 2 , -3 db, 2.4 usec
tap 3, -9 db, 2.7 usec
tap 4, -14 db, 5.4 usec
now consider that your waveform is sampled at Fs = 10 MHz (you will specify this in the definition of the rayleigh channel). When you input this waveform to this channel, you can see that to reach 5.4 usec you need 5.4u/0.1u = 54 samples to pass through! That means what you will observe at the output is that your channel is 54 samples wide. So, the relationship of h's length in your case is to the sampling interval you specify in the rayleighchan command and not to the actual channel delay profile. Hope that answers the question.
Ubaid
Hi Ubaid,
ReplyDeleteThank you very much for your reply.
For GSM, the sampling period is Ts = 3.69 us. I consider an oversampling rate of 1. My PDP profile is:
tap 1, -3 db, 0 us
tap 2, 0 db, 0.2 us
tap 3, -2 db, 0.5 us
tap 4, -6 db, 1.6 us
tap 5, -8 db, 2.3 us
tap 6, -10 db, 5.0 us
TAU = [0 0.2 0.5 1.6 2.3 5.0]*1e-6
Pdb = [-3 0 -2 -6 -8 -10]
I consider a max doppler shift of Fd = 2.5 Hz
So my channel is:
chan = rayleighchan(Ts,Fd,TAU,Pdb)
As we can see, the max delay is 5 us which is less than 2*Ts. I think that the max FIR's length would be 2. But when i compute the FIR's length as described previously, i get 10. Why ?
I have another question. Although i put the chan.NormalizePathGains to 1, my filtered signal (my input signal has a power of 0 db) has a power less than 0 db. Why ?
Thanks for your help.
Michael
Did you check the relative power of the taps? When you get h, convert it to dBs. Your 2nd tap will be around -10 dB and all other taps will be below that value. You will definitely get the taps more than 2 but their relative power will be smaller.
ReplyDeleteHow long is your signal vector?
Hi Ubaid,
ReplyDeleteYou are right. My 2nd tap is around -10 dB and all other are below -20 dB.
For NormalizePathGains, my signal vector length is 2000. Is this size small ?
Thanks for your help.
Michael
My problem is that I generated a channel matrix per tap (=path) : H_tap of dimension [Tx, Rx], where Tx and Rx is the number of Tx and Rx antennas respectively. For a system level simulation I have to calculate the simulated OFDM channel H with dimension [Tx Rx NoCarrier] (without taps). I did the following: I put all complex pathgains into a vector Hn and calculated: H = fft(Hn, noCarrier). Is this correct? The problem I have is that the H_tap have different path delays. Do I have to account for that?
ReplyDeleteYes you will have to account for those delays. When you perform the fft the frequency content that it displays is from 0 to sampling frequency Fs. If you have multiple taps and they are not sample spaced you have to interpolate them first so that they all share the same sampling frequency. For example, consider following two channels.
ReplyDeletei) tap1 = 0 sec tap2 =.1 sec tap3 = 0.7 sec
ii) tap1 = 0 sec tap2 = 0.5 sec tap3 = 1.5 sec
now to simulate them you will have to choose the sampling interval of 0.1 sec. you will interpolate both the channels to 0.1 sec and then with new h1 and h2 you can use the same fft command. Now they can be compared to each other based on their spectrum.
Hope that answers your question.
Hi Ubaid,
ReplyDeletethank you for your fast replay. What do you exactly mean with interpolation? What happens if 2 or more paths fall into the same sampled tap? Do I have to add up the corresponding channel coefficients? What about unused sampled taps? Should I put a zero in it?
A friend meant that for the computation of the baseband channel representation I have to use the sinc() function as proposed by D. Tse in "Fundamentals of Wireless Communications", Cambridge university press . Is it correct?
[From email]
ReplyDeleteHi Ubaid,
How you doing?
Read your DSP blog. It's very informative.
I am a graduate student at ***. I am working on End-to-End simulation of an OFDM communication system and trying to analyse OFDM's resilience to Multipath fading when compared to plain QPSK or 16-QAM baseband modulation.
I am simulating a Rayleigh Multipath channel with Rayleighchan() function in Matlab. The problem i am facing is that i am not sure if i am doing the Channel Equalization correctly. I am trying to implement Zero Forcing Equalization. I tried few suggests you have posted in your blog but those doesn't seen to work in my code. Interestingly plain multiplication as in multiplication of the modulated data with channel impulse response and dividing the received data (with Multipath Fading and AWGN) with the channel impulse response give me better results. I fail to understand this as ideally convolution with channel impulse response becomes multiplication only for Flat fading case and not Multipath fading but in my case it is showing better results.
I am attaching my m-file. It's pretty well commented. Request you for your comments and suggestions.Really need your help as my submission is very near.
Thanks a lot in advance.
Looking forward to your help.
Regards
Ishwinder
Looking at your code I dont understand the following things.
ReplyDelete1. changain=filter(h,ones(102624,1));
if you are trying to know the channel impulse response as you have used this changain in equalization, you will have to pass the impulse through this channel.
changain=filter(h,[1 zeros(102623,1)]);
2. msg_rx = c1*msg_rx./changain
you are equalizing by division in time domain. This single tap channel equalization is in the case of ofdm or if you take fft of the received signal.
just to give you an idea .. i'm sending you a matlab script ... hope that helps
Hi Ubaid,
ReplyDeleteThanks a lot for response.
1.Yeah you have correctly pointed out that i am trying to know the channel impulse response and should have used changain=filter(h,[1 zeros(102623,1)])
2. I understand that it's single tap channel equalization but it's still giving me results for Multipath Rayleigh fading channel(Multi-tap equal sample spaced channel in my case). I fail to understand this.Request your comments.
3. Can i request you for steps to be kept in mind when designing a Channel Equalizer for Multipath Rayleigh Fading channel
I am trying to understand the test script you sent.
Thanks
Ishwinder
you can do that single tap equalization only if you are doing frequency domain equalization i.e. some sort of fft at the receiver. I don't see any fft on the receiver. What you are doing is first multiplying the data with channel response and then dividing it from the same. Its simple multiplication and division thats why giving you near fine response (as awgn is involved as well). There is no such multiplicative channel i.e. you should use filter or conv command to model it not .* operator. The purpose of your work is not to perform any channel estimation or equalization specifically. To assume perfect knowledge of the channel, you can take FFT of the channel response, invert it and then convert back to time domain using ifft. Use this time-domain inverted channel response to filter the received data as I did in my script. This filtering on the receiver is your perfect channel equalization. I didn't test it but that's the way you can work it out. You cannot just multiply the channel response with your data and then divide it. You have to convolve with the channel response and then convolve with the inverse channel response. Hope that helps.
ReplyDeleteUbaid
Hi Ubaid,
ReplyDeleteThanks for clarifying concepts on Channel estimation.I tried your suggestions and your test script for Perfect channel estimation but it doesn't give me proper results. I have sent you an email in this regard.Kindly provide your valuable comments and assistance.
Thanks
Ishwinder
Hello Ubaid
ReplyDeleteJust now I entered here. Your explanation clarified many things.
I am doing research work. Have to check OFDMA performation with 3GPP channels. They are rayleigh channels with high doppler.
tau = [ 0 200 700 1200 1720 2150]nsec
P_dB=[-2.5, 0, -5, -10, -15, -20]
I m assuming channel is static during ofdm symbol and changes symbol to symbol. I considered 32 symbols for testing SER.
I have generated 6 rayleigh sampled channels for 32 time variants. Took sampling freq same as symbol rate =1/OFDM symbol dutation. Is it correct?
First timevariant of each of 6 rayleigh channels are considered as vector and they are placed at the delays (delays are converted to no. of samples ... here I considered sampling time which can be calculated from symbol duration/fft size).
Similar procedure was used for next 31 channels for 31 symbols.
Then I don't how to implement them in matlab simulation. Can u help in this regard?
I will wait for your reply.
regards
Pushpa
Yes you are right.
ReplyDelete>>>> First timevariant of each of 6 rayleigh channels are considered as vector and they are placed at the delays (delays are converted to no. of samples ... here I considered sampling time which can be calculated from symbol duration/fft size). <<<<
it should be noted in this case symbol duration is without cyclic prefix.
Additionally, to evaluate SER, 32 symbols are insufficient. 32000 would be a better figure.
I couldn't understand what does it mean by delays are converted to no. of samples. The delays should also be used to append zeros to account for the unequal spacing between two taps. So, in the end the final channel vector will not be 6 elements long.
>>>> Then I don't how to implement them in matlab simulation. Can u help in this regard?<<<<
1. construct a 6 tap channel according to this script and your power delay profile.
2. append zeros based on your sampling interval. (for better methods use the techniques described in http://www.mathworks.com/matlabcentral/fx_files/18869/1/ChannelModelingWhitePaper.pdf
3. use filter command to apply the effect of channel on each symbol.
Hello Ubaid,
ReplyDeleteThank you very much for the quick reply.
I m in need of it.
I mentioned 32 OFDM symbols, each containing 568 QPSK symbols, therefore 32x568=18,168 QPSK symbols at the demap and may be sufficient to check SER (symbol error rate). I will increase this number.
I have passed the signal through FIR filter for symbol by symbol filtering... that is I used the command conv(symb(1,:),chan(1,:)) and then removed additional sample points...if L1 and L2 are symbol and channel lengths then filter output is L1+L2-1, I have removed last L2-1 samples. I repeated this process for all symbols.
Then noise and frequency offset added to the resulting channel output sequence.
At the receiver, I estimated channel using preamble (ist symbol) using the PN sequence known and then found its FFT...fft(chan_est,N) and then used it for channel equalizer for all the data symbols and demapped.
Believe me I am getting probability of symbol error = 0.885.
I know somewhere I went wrong.
Please help me in this regard.
I have downloade that white paper, will go through it now.
I will wait for your reply
regards
Pushpa
Tap Delays are converted to no. of samples ... here I mean...
ReplyDeleteif the sampling time interval is 2 ns and Tap delay = 200 ns, then that delay in terms of samples = 200 ns/2 ns = 100 samples. Therefore after first tap at 1st sample, I placed 99 zeros and then placed second tap value. Appended some more zeros between 2nd and 3 tap depending on its delay.
taps_rel_ave_Pow_dB=[0 -1 -9 -10 -15 -20];
taps_rel_ave_Pow=10.^(taps_rel_ave_Pow_dB/10);
%%%relative times of channel taps
taps_rel_time=[0 310 710 1090 1730 2510]*10^-9;
taps_rel_samples=ceil(taps_rel_time/T_sample);
taps_rel_samples = [0 5 19 28 53 85]
for k=1:num_variants
chantaps_symb_normalized(k,:)=taps_rel_ave_Pow.*[tap1_normalized(k),tap2_normalized(k),tap3_normalized(k),tap4_normalized(k),tap5_normalized(k),tap6_normalized(k)];
end
%%%%%%%%%taps_rel_samples = 0 5 19 28 53 85
for k=1:num_variants
chantaps_symb_normalized(k,:)=taps_rel_ave_Pow.*[tap1_normalized(k),tap2_normalized(k),tap3_normalized(k),tap4_normalized(k),tap5_normalized(k),tap6_normalized(k)];
end
for k1=1:num_variants
channel_doppler(k1,:)=[chantaps_symb_normalized(k1,1),zeros(1,5) chantaps_symb_normalized(k1,2),zeros(1,18), chantaps_symb_normalized(k1,3),zeros(1,27), chantaps_symb_normalized(k1,4),zeros(1,52), chantaps_symb_normalized(k1,5),zeros(1,84), chantaps_symb_normalized(k1,5)];
%%%unit norm channel
end
Is this code correct?
If it is needed I will post entire code here.
Yeah...in symbol duration, I considered without cyclic prefix.
Please give me the reply.
regards
Pushpa
I am simulating PSK modulation with Rayleigh fading channel using SIMULINK, I get the error message : {The input width must be scalar >0]
ReplyDeletecan any one plz tell me ,whats the solution?
@BEAMFORMING
ReplyDeleteCan you post the exact MATLAB code?
Its actually Simulink model,not the MATLAB code.. I can Email you,
ReplyDeleteThanks
your email address plz.
ReplyDeleteI have emailed you,plz if you can catch the problem
ReplyDeleteyou can find my model at link:
ReplyDeletehttp://www.mathworks.com/matlabcentral/fileexchange/32169-8-psk-with-rs-coding-in-rayleigh-fading-channel
Dear Obaid,
ReplyDeleteI have been reading this article since one hour and find it quite interesting. you highlighted very important things. Please keep up the good work. as i was reading the questions that public has put, suddenly i find some confusion. rramya asked in her one of the post that we should use Eb_No = 10^(Eb_No_db/20) in order to deal with voltages instead powers. and u asked her to normalization. After that she normalized as:
norm_each_tap_weight=taps_weights/sqrt(sum(tap_weights_ln));
norm_fact = sqrt(sum(tap_weights_ln.^2));
taps_norm = 1/norm_fact*norm_each_tap_weight;
dont u think she has done normalization twice?
BR
Talha
You are right Talha ... I didn't look at her code right now but I don't think she should normalize with a function of tap_weights_ln twice...
ReplyDeleteOne more thing that i would like to discuss with you is ...suppose we want to simulate an audio signal at data rate of 13kbps ....i dont want to include audio in matlab but i want to generate binary data at 13 kbps for my SCFDMA modem.....what do you think how can i do it?
ReplyDeleteBR
Talha
you mean you want to generate 13kbps voice at the output of your sound card? i didn't get your question
ReplyDeletelemme elaborate it.... when i generate a random bit stream ....i want to generate it at 13 kbps ....since i can not generate 13000 bits at one time coz with SCFDMA it is not possible.....any hints???? i guess it has to do with channel that should behave in such a way that my bit stream experience fading as if 13kbps signal experiences the fading while passing thru the channel...
ReplyDeleteI don't understand what do you mean by generating a bit stream at 13 kbps. In a digital sampled system, a bit stream at 13 kbps is the same as bit stream at any other bit rate when you treat the sampling time between bits differently. For example, bitstream = [1 0 1 1 1 0] can be at 13 kbps or 26kbps or on any other bit rate for that matter. You will have to treat this difference in sampling time in your algorithms if you are manipulating these bits. So if you are asking how to generate 13 kbps bit stream my answer would be generate a bit stream using the following.
ReplyDeleteF = 1/13e3;
bitstream = randint(1, no_of_bits);
and now use the information stored in F variable further in your simulation to give your algorithms the information that it is sampled at 13 kbps.
Hey Ubaid,
ReplyDeleteI was reading your blog after such a long time. i had a confusion in my mind that should we treat channel taps as voltage impulses or power impulses. e.g., should we convert them like 10^(-chan_tap_db/20) or 10^(-chan_tap_db/10). I am asking u this because i have seen different articles using these two conversions. Thank You
The tap values reflect their relative power w.r.t. the 0-delay tap. This is the reason we take square root to convert them to a voltage value and then multiply with the unit power signal.
DeleteI am sorry....but i m still confused here....
DeleteDear Ubaid,
ReplyDeleteOne more thing, how would be the impact of complex pathgains on our signal .....like from ur rayleigh function we have complex (real + imag) path gains ...i have seen codes that consider only real paths gains (tap values).
Can you please explain this.
Thanks
If you use complex path gains, you can account for the randomness in phase delays. If you remember a complex number can be written as a+bi = Aexp(j x theta). So, if your path gains are real, you won't be able to introduce the randomness in the phase of the signal.
DeleteThank You for this answer. I understand this now. :)
Deletesir,
ReplyDeletecan u tell me how to generate oversampled impulse response (4 by 3) that i can use to simulate my channel estimation code.
my code is working for (1 by 3) but not for (4 by 3) .my impulse response is time varying.
Vanita
What is 4 by 3 and 1 by 3 ?
DeleteHi Ubaid Abdullah ,
ReplyDeleteif we have channel impulse response = [0.4544 -0.0036 0.0065 -0.0107 0.0169 -0.0267] , how i can extract the path gain from the channel impulse response.
cheers ,
cheers ,
Can you please explain what do you mean by path gains? In my opinion, $[0.4544 -0.0036 0.0065 -0.0107 0.0169 -0.0267]$ are path gains?
DeleteHELLO,
ReplyDeleteTHANK YOU FOR YOUR CODE AND EXPLANATION. WHEN I TRY TO LOT YOUR CODE, ITS NOT SAME AS A FADING CHANNEL, ISN'T IT. WOULD YOU PLEASE LET ME KNOW HOW CAN I PLOT THE HISTOGRAM OF THAT?
AND HOW WE CAN CREAT THE CHANNEL ANALYTICALLY. I MEAN WITH WHICH KIND OF DISTRIBUTION WE CAN MAKE A SAME HISTOGRAM THAT YOU HAVE MADE NUMERICALLY.
THANKS
Hi Ubaid Abdullah,
ReplyDeletedear i am Mohammed , i try now to make matlab code that explain the Bidirectional LMS algorithm over fast fading channel , and this subject is related to above your simulating of Rayleigh fading channel , please if you have any information about this code for BI-LMS please support me.
Thanks a lot
Hello Sir,
ReplyDeleteThank you for the well explained topic.
I have some questions:
1- what o you mean by averaging_interval
2- how can I get the channel impulse response
Awaiting your reply!
Many thanks in advance
Also why you didn't use the "tap_delays" in generating the channel matrix?
ReplyDeleteWe didn't use tap_delays in generating channel matrix because all delays are equally-spaced, i.e., they all are 5 microseconds apart. In this special case and under the assumption that symbol period is 5 microseconds, each channel tap is one sample apart. The code will not work for any other case in which the condition of sample-spaced channel taps is not true. For example, the code will not work in the case of tap_delays = [0 1e-6 17e-6 20e-6]. You will need interpolation techniques to interpolate the channel at sample-spaced position in this case.
ReplyDeleteAsslam Aliukm Dear Ubiad,
ReplyDeleteMy name is Adam, and I am graduate student doing research in WCDMA erea.
I read you article on "http://dspdotcomm.blogspot.com/2008/11/simulating-sample-spaced-rayleigh.html" which is titled as "Simulation Sample Spaced Rayleigh Channel".
Actually I am working on performance analysis of MAI in WCDMA system using different spreading codes. I tried many times to generate Rayleigh selective fading channel and calculate its BER performance
I think I have problem with the channel itself but I could not figure it out.
I tried your code also by convolving the input signal with the "taps" in your code. However, i did not get the correct answer or figure.
I am really stuck in this fore weeks now so any help or hints are really appreciated. thanks in advance.
Best Regards,
Adam,
Asslam Aliukm Dear Ubiad,
ReplyDeleteMy name is Adam, and I am graduate student doing research in WCDMA erea.
I read you article on "http://dspdotcomm.blogspot.com/2008/11/simulating-sample-spaced-rayleigh.html" which is titled as "Simulation Sample Spaced Rayleigh Channel".
Actually I am working on performance analysis of MAI in WCDMA system using different spreading codes. I tried many times to generate Rayleigh selective fading channel and calculate its BER performance
I think I have problem with the channel itself but I could not figure it out.
I tried your code also by convolving the input signal with the "taps" in your code. However, i did not get the correct answer or figure.
I am really stuck in this fore weeks now so any help or hints are really appreciated. thanks in advance.
Best Regards,
Adam,
This comment has been removed by the author.
ReplyDeleteThis comment has been removed by the author.
ReplyDeleteI am graduate student doing research in ICI in OFDM due high mobility and i have many problem in channel
ReplyDelete1.the channel assumed to be linear time varying as follows hn=c+a*n and NCP<n<N-1,is the relation bet i/p and o/p is still convolution or not?
2.the PDP as follows:
TAU = [0 0.2 0.5 1.6 2.3 5.0]*1e-6
Pdb = [-3 0 -2 -6 -8 -10]
I consider a max doppler shift of Fd = 100 Hz
and Each channel delay tap is generated by Jake’s model.How can i get the channel?
thanks